
Retail shrink is the gap between book inventory and physical inventory, usually measured as a percentage of sales. In 2025 reporting, the term is also being stretched toward broader retail loss, which some coverage places at $796 billion.
Retailers need that tighter textbook definition because the number alone doesn't tell the full story. A gap can come from theft, but it can also come from receiving mistakes, damage, vendor fraud, and process errors, and those differences change what a store manager should fix first.
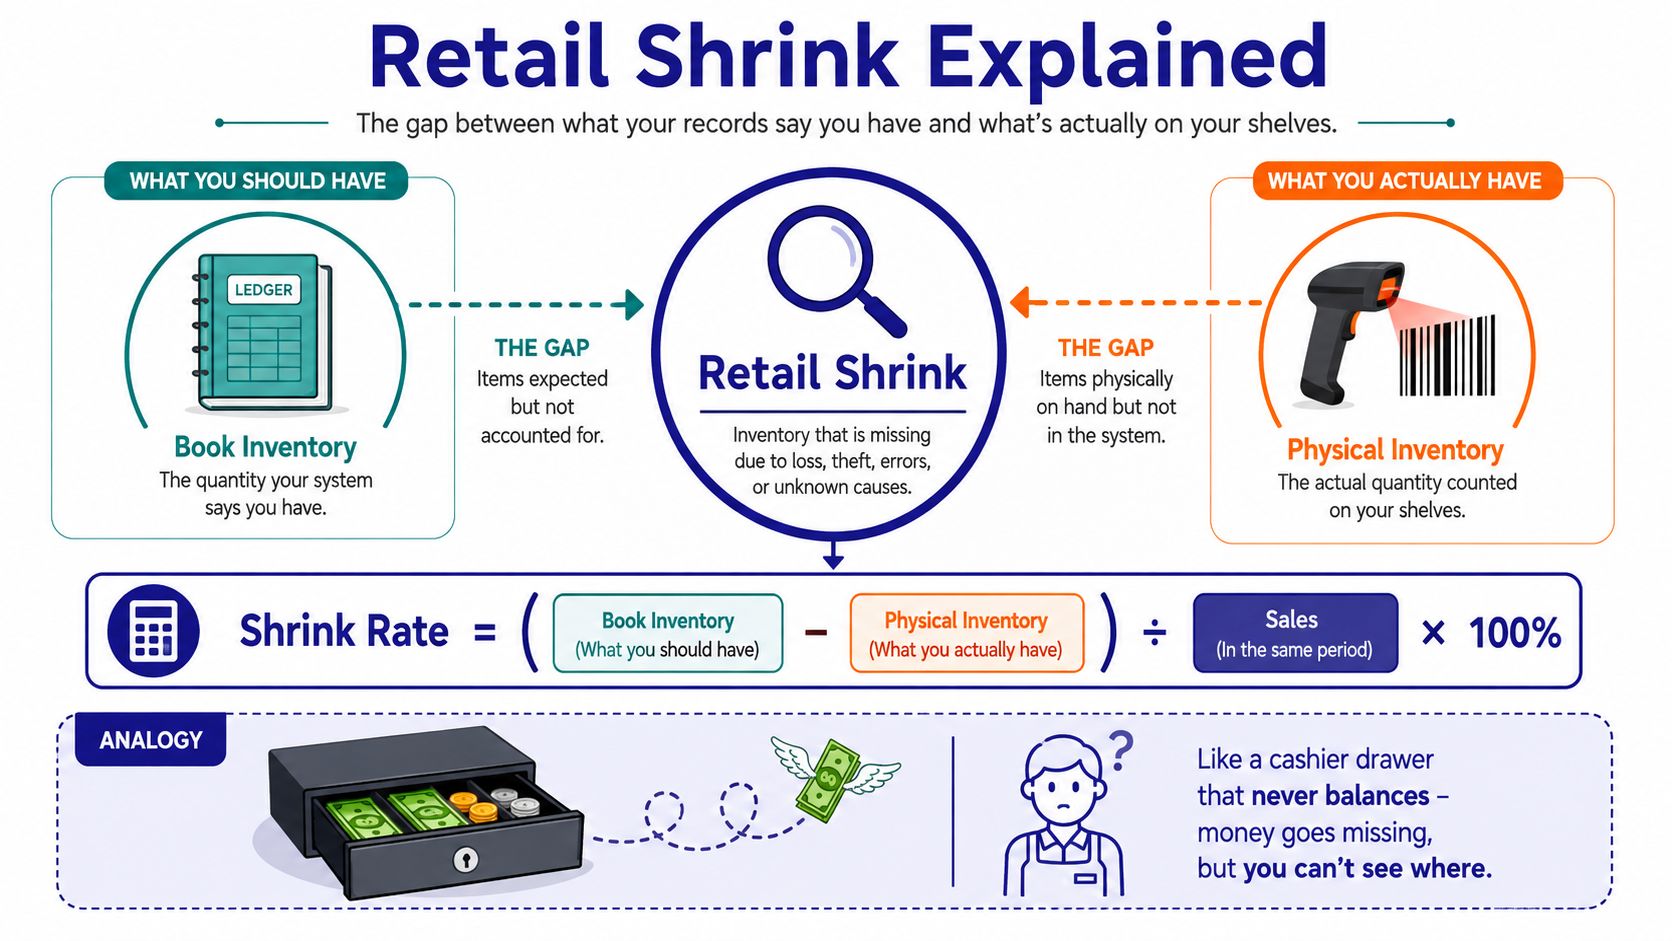
Table of Contents
What Retail Shrink Really Means and Why the Definition Matters
Why the definition has to stay precise
How to Calculate the Shrink Rate Step by Step
A grocery example a store manager can follow
What usually causes mistakes in the calculation
The Four Main Causes of Retail Shrink
How the four causes behave differently in the store
What this means for action
Why Most Shrink Is Not Shoplifting
What managers think they are fighting
What audits usually show instead
Practical Ways to Reduce Shrink in Your Store
Match the control to the cause
Where the operational gains usually come from
Benchmarks and Numbers Every Retailer Should Know
What the benchmark looks like in real stores
How to use the benchmark without overreading it
Putting It All Together A 30 Day Action Plan
Week 1 to Week 2
Week 3 to Week 4
What Retail Shrink Really Means and Why the Definition Matters
The cleanest retail shrink definition is simple, recorded inventory says one thing and the physical count says another. Industry reporting also treats shrink as a percentage of sales, which makes it easier to compare stores, departments, and time periods, rather than looking at raw dollar gaps that can be misleading in larger operations. The NRF's FY2022 survey put shrink at 1.6% of sales, equal to $112.1 billion in U.S. retail losses, up from 1.4% and $93.9 billion the year before, which shows why even a small percentage deserves attention (retail shrink statistics and NRF survey summary).
A useful way to think about it is a cashier drawer that should close at $500 and ends at $487 with no recorded reason. The missing $13 is the gap, but the question is where it went. Was it a counting error, a void that never got corrected, a damaged item written off too late, or theft that never hit the audit trail?
Why the definition has to stay precise
Retail teams get into trouble when they use shrink as a catch-all word for every loss. The NRF has long tracked shrink as a percentage of sales, and that framework still matters because it keeps budgeting and loss prevention grounded in the same measurement standard (NRF on the reality of retail shrink). At the same time, recent coverage says 2025 reporting is broadening retail loss to include returns abuse and other leakage, which means the textbook definition is still necessary, but no longer sufficient for every planning conversation (2025 retail loss coverage).
Practical rule: if the store can't explain the gap between book and physical stock, the problem is not solved yet, it's only been labeled.
That distinction matters because managers need to answer three separate questions. What caused the gap, how large is it in dollars and percentage terms, and which controls close it. Once those are separated, shrink stops being a vague headache and starts becoming a measurable operating problem.
How to Calculate the Shrink Rate Step by Step
The formula is straightforward, Shrink Rate = (Book Inventory - Physical Inventory) ÷ Sales × 100. The challenge is not the math, it's making sure each input is clean enough to trust. A manager can do the calculation with POS sales, purchases, and a counted ending inventory, without needing a complicated ERP setup.
A grocery example a store manager can follow
Start with recorded beginning inventory of $1,200,000. Add $800,000 in purchases, then subtract $1,650,000 in recorded sales. That gives an expected ending book inventory of $350,000. If the actual physical count is $341,000, the gap is $9,000.
Shrink Rate Calculation Walkthrough | Amount |
|---|---|
Beginning inventory | $1,200,000 |
Purchases | $800,000 |
Recorded sales | $1,650,000 |
Expected ending book inventory | $350,000 |
Actual physical inventory | $341,000 |
Inventory gap | $9,000 |
Now divide the $9,000 gap by $1,650,000 in sales, then multiply by 100. The result is a 0.55% shrink rate. That number tells the manager far more than the dollar gap alone, because it puts the loss in the context of sales activity.
What usually causes mistakes in the calculation
The most common confusion is not the formula, it's bad inputs. A store can distort shrink if units of measure are mixed, if receiving wasn't posted correctly, or if stock counts were taken before all sales were booked. A clean shrink calculation starts with a clean count, a clean sales number, and a clean purchase trail.
When a manager sees a strange shrink rate, the first question should be whether the inventory math is wrong before assuming theft is the answer.
A simple discipline helps here. Reconcile book stock to physical stock, confirm the unit of measure for the SKU, and make sure the count period is defined the same way every time. That gives the store a repeatable baseline instead of a one-off number nobody trusts.
The Four Main Causes of Retail Shrink
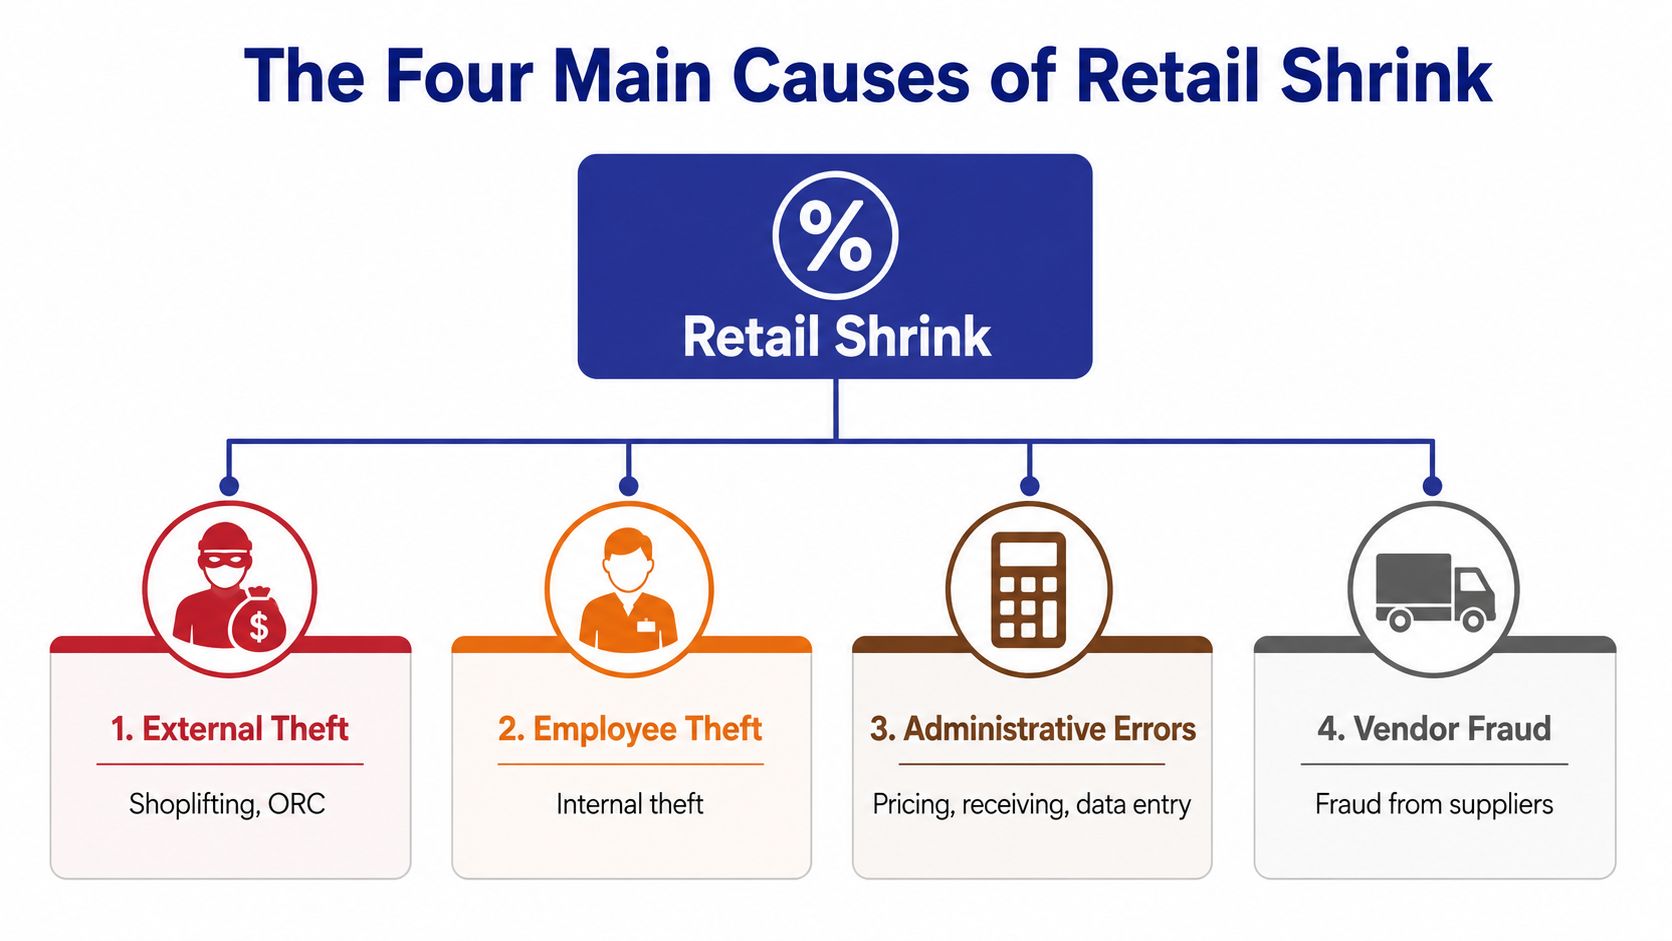
Retail shrink is usually grouped into four causes, and the NRF's taxonomy still makes the most sense for store operations. External theft covers shoplifting and organized retail crime, employee theft covers internal theft, administrative and process errors cover pricing, receiving, and count mistakes, and vendor fraud plus damage covers supplier issues and inventory write-offs (NRF shrink overview).
How the four causes behave differently in the store
External theft is the most visible because it happens at the sales floor or exit. Employee theft is harder to see because it leaves behind a familiar face and often a messy audit trail. Administrative errors are quieter still, and that's where managers often misread the problem, because the loss looks like shrink but the actual fix is a process change.
Vendor fraud and damage sit at the back end of the flow, often during receiving, storage, or transfer. That makes them easy to overlook if the store only watches the front door. A department can tighten exit controls and still miss shrink if invoices, deliveries, or damage write-offs aren't being checked with the same discipline.
For retailers handling high-risk goods, the product mix matters too. Brands with exposed, resellable, or easily swapped goods often need tighter packaging and authentication controls, and a counterfeit prevention guide can help teams think through that risk alongside normal shrink controls.
What this means for action
The useful move is not to memorize the four labels, it's to assign each one to a control owner. Exit theft belongs with physical deterrence and observation. Internal theft belongs with access control and audit trails. Errors and vendor issues belong with inventory accuracy, receiving discipline, and invoice checks.
A manager who treats all four causes the same will overspend in one place and under-invest in another. That's why a shrink program needs both floor-level security and back-room process control.
Video coverage is often useful for exit points and dispute review.
For stores that need hardware at the point of exit, solutions such as systec POS-Technology GmbH's SmartSafe system fit into a broader prevention program.
Why Most Shrink Is Not Shoplifting
The default assumption in many stores is that shrink is mostly a theft problem. Current reporting pushes back on that, because newer coverage says 2025 retail loss reached $796 billion, while only $90 billion was attributed to shrink in that framing, and the loss picture was still dominated by controllable process issues in many categories (2025 retail loss coverage).
What managers think they are fighting
Most store teams picture a theft event first. They think about shoplifting, ORC, or an employee walking product out the door, and those events are real. The issue is that the stock room often points somewhere else, to receiving mistakes, scan-file problems, production planning errors, or weak handling discipline. In grocery, one supermarket shrink survey found 64% of shrink came from operational failures and 36% from theft, which is a very different split than many managers assume (supermarket shrink split).
What audits usually show instead
That gap changes the budget conversation. If the biggest loss bucket is operational, then more cameras at the door will not fix it. Teams need cycle counts, receiving audits, markdown controls, return discipline, and supplier reconciliation before they can expect a big shrink reduction.
The same logic applies as reporting expands into broader retail loss in 2026. Security hardware still matters where product exits are exposed, and a security systems category page can help teams review that layer, but it should sit alongside process redesign. A loss-prevention program that only watches the front door is reacting to the most visible symptom, not the biggest source of loss.
For store managers, the decision rule is simple. If the variance shows up in counts, paperwork, or receiving, it belongs to operations. If the variance shows up at the exit or on open display, it belongs to physical deterrence. If it spans both, the store needs both.
Practical Ways to Reduce Shrink in Your Store
The strongest shrink programs usually layer three responses instead of choosing one. Physical measures protect high-risk exits and open display, procedural measures tighten inventory accuracy, and technology reduces blind spots in counting and transaction review. The right mix depends on whether the loss is being created by people, processes, or access points.
Match the control to the cause
Physical controls work best against external theft and pushout behavior. That includes EAS gates, locked cases, mirrors, and fixture layout changes that make hot categories harder to grab and leave with. Procedural controls address administrative error, so they focus on cycle counting, receiving audits, refund review, and supplier reconciliation. Technology, including RFID, computer vision, and exception reporting on POS activity, helps the team find patterns earlier and catch mismatches before they compound.
A useful external reference for store teams thinking about camera-led deterrence is Securitec Security's retail CCTV guidance, which sits in the broader category of surveillance rather than inventory control.
Shrink Mitigation Measures by Layer | Example Measures | Primary Cause Addressed | Typical Cost Tier |
|---|---|---|---|
Physical | EAS gates, locked cases, mirrors, layout redesign | External theft | Medium to high |
Procedural | Cycle counts, receiving audits, void controls, supplier reconciliation | Administrative error, vendor issues | Low to medium |
Technology | RFID, computer vision, analytics on POS exceptions, unified stock visibility | Mixed causes, especially blind spots | Medium to high |
Where the operational gains usually come from
Most stores get the fastest improvement from boring controls that get used every day. Receiving teams that check against purchase orders catch problems earlier. Department heads who review voids and refunds spot patterns faster. Category managers who reconcile vendor invoices reduce the chance that a paper error gets mistaken for theft.
Field lesson: a store doesn't need every control on day one, it needs the one that matches the most expensive gap.
Hardware still has a role at high-exit-risk sites, and one option in that category is systec POS-Technology GmbH's StopLoss system, which is designed to block trolley pushout attempts without relying on staff confrontation. It fits best where the loss pattern is tied to trolley movement rather than shelf pick-up.
For teams building a full stack, the trend in 2026 planning is toward bundled suites that combine video, RFID, and POS analytics. That cuts down on isolated tools that can't talk to each other and makes it easier to trace a gap from count to exit.
Benchmarks and Numbers Every Retailer Should Know
The most useful benchmark for retail shrink is still the NRF range of 1.4% to 1.6% of sales, with the latest cited U.S. figure at 1.6% in FY2022 (NRF shrink statistics). The percentage looks small on paper. In a store, it behaves like a leak in a roof, slow at first, then expensive once the sales base gets large.
What the benchmark looks like in real stores
A grocery operation doing $40 million in annual sales would be looking at roughly $560,000 to $640,000 in shrink if it sits in that range. A DIY format doing $120 million in annual sales would be looking at roughly $1.7 million to $1.9 million. Those are not rounding errors. They are line items that can change margin, staffing, and capital plans.
The broader $796 billion retail loss figure should be read differently. It covers a wider set of leakage categories than traditional shrink, so it helps explain the total pressure on retailers. It should not replace the book-to-physical shrink metric used for store control and budgeting (2025 retail loss coverage).
How to use the benchmark without overreading it
Benchmarks work like a warning light, not a verdict. A store above the range needs a root-cause review, but a store inside the range can still have one department or one process that is out of control. That is why managers should track shrink by category, format, and store type, not just by chain average.
A chain average can hide one bad receiving process, one weak exit point, or one high-risk department that deserves its own plan.
For grocery and DIY, every improvement in shrink rate matters because the dollar base is so large. A small drop can free up meaningful margin, even before a store changes staffing or resets its loss-prevention hardware. The exact impact still depends on the store's actual sales and margin structure.
Putting It All Together A 30 Day Action Plan
A good shrink plan starts with measurement, not shopping for tools. The first month should produce a clean baseline, a clearer cause split, and a decision on which controls belong at the exit, in the back room, or in the counting process. Stores that skip those steps usually buy hardware before they understand the loss.
Week 1 to Week 2
Week 1 should reconcile book inventory to physical inventory and confirm the unit of measure on the top-loss SKUs. The owner is usually the inventory manager or finance lead, and the deliverable is a baseline shrink rate by department. Week 2 should target administrative error first, because that is where many stores find a large share of preventable loss, especially in receiving, markdowns, and vendor invoices.
For entrance and exit control, systec POS-Technology GmbH's SmartGate is one hardware option for managing passage while checking for misuse. It belongs in the discussion only when the store's loss pattern points to that control point.
Week 3 to Week 4
Week 3 should review physical controls at high-risk exits and high-shrink displays. That means tagging standards, gate placement, and CCTV coverage around the SKU groups that keep showing up in count variances. Week 4 should bring in technology only after the process work is visible, so RFID counts, computer-vision monitoring, and analytics dashboards can measure against a baseline instead of guessing.
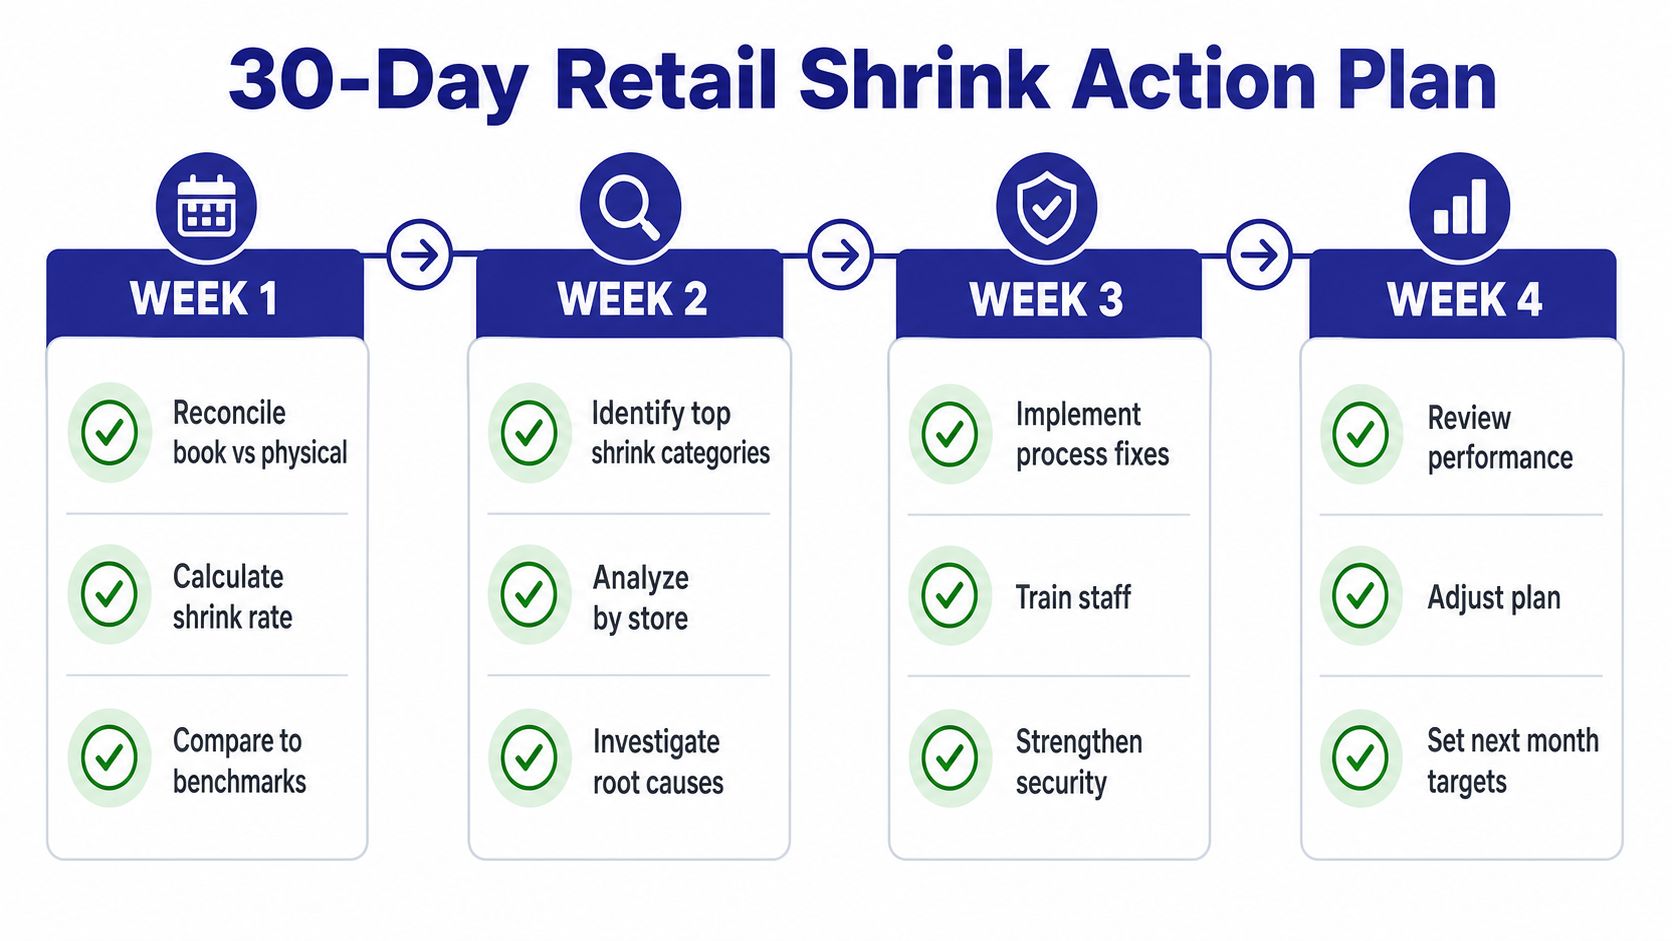
The deliverable at day 30 should be a shrink dashboard with owners, dates, and category-level actions tied back to the original inventory gap. That keeps the work auditable, which matters more than a one-time count win. Retailers that treat shrink as a recurring operating process tend to see better follow-through than retailers that treat it as a quarterly fire drill.
For retail teams that want to reduce shrink at the source, systec POS-Technology GmbH develops security and accessory solutions for shopping trolleys, store entrances, and loss-prevention workflows that can fit into existing retail processes. Visit systec POS-Technology GmbH to review options that connect exit control, trolley security, and store operations in one practical program.
Resources
Related articles


Wir schützen Ihren Umsatz
Wir bieten professionelle Beratung zu Einkaufswagen-Zubehör und Warensicherung.